How US Inflation Has Changed Over 100 Years
Written By AsYouSow
SOURCE: Advisor Chanel
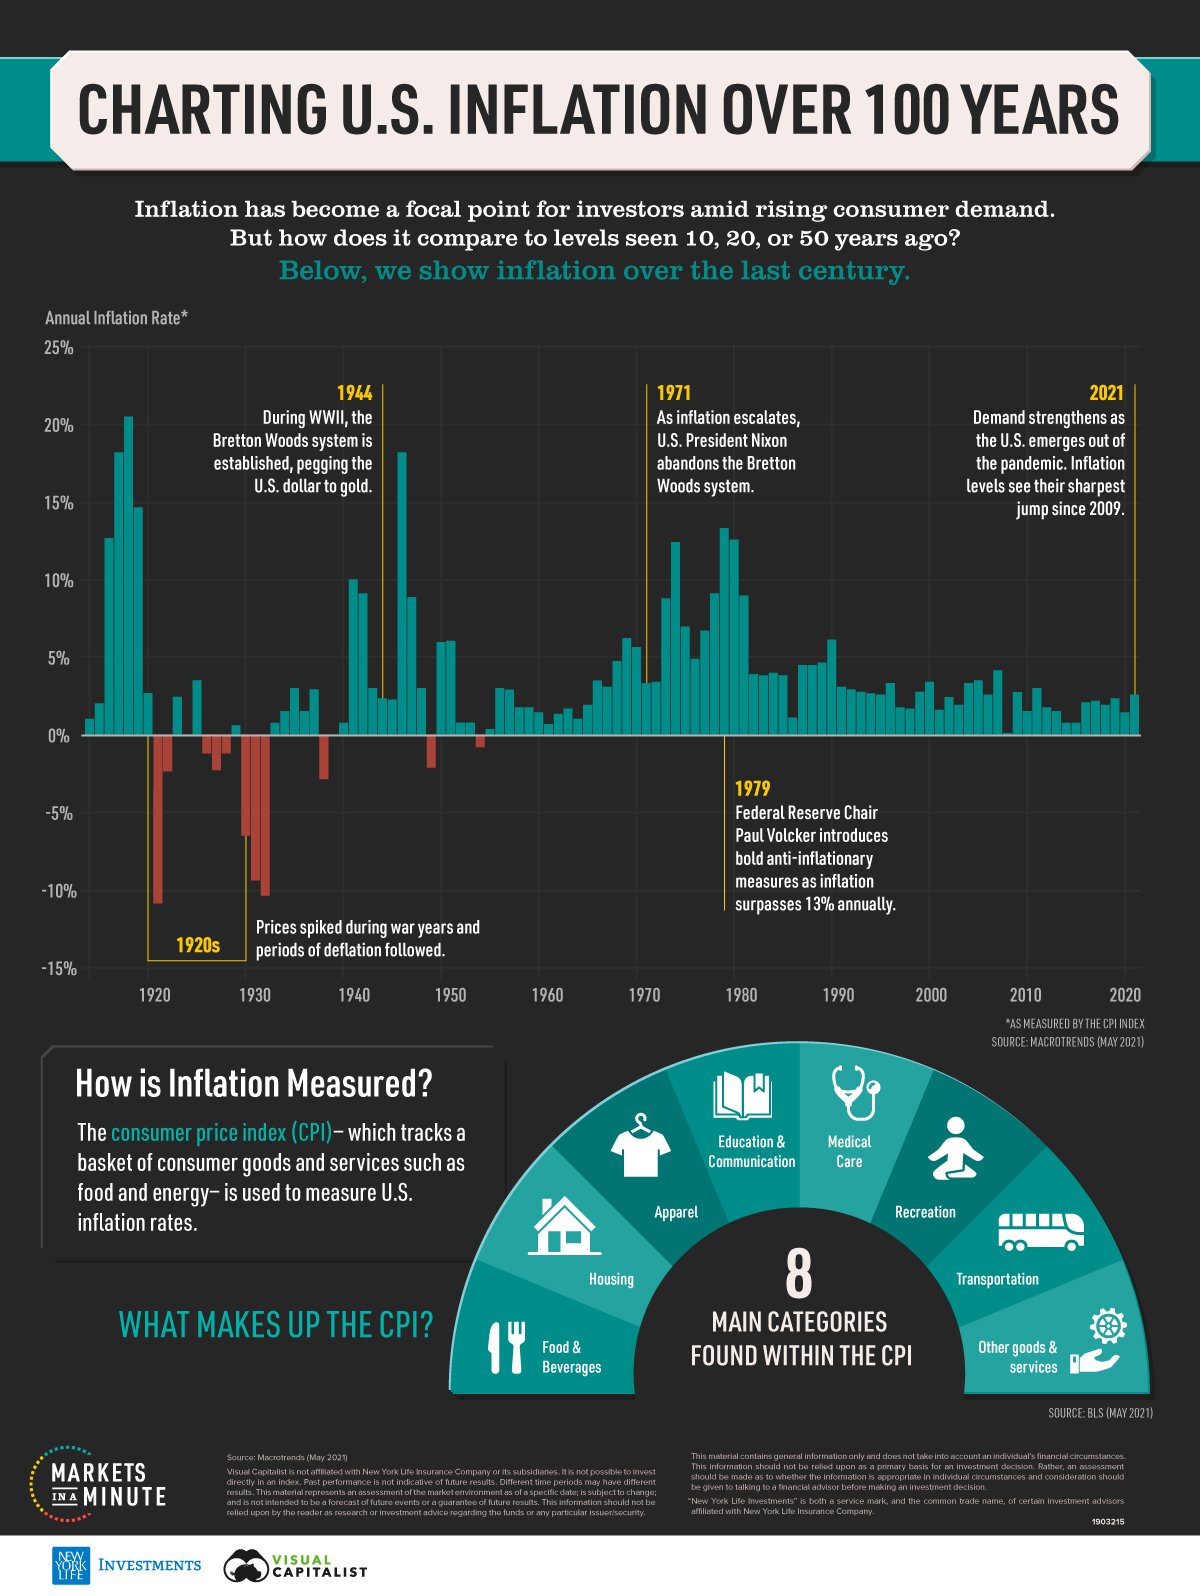
Economists quantify inflation using a percentage, like 2% or 3%, which represents the average rate at which prices are rising. They rely on a tool called the Consumer Price Index (CPI) to calculate the percentage. The CPI tracks price changes for the same basket of goods and services, enabling us to understand how much the items we commonly purchase have become more expensive. This infographic illustrates US inflation over the past 100 years.
Explore More